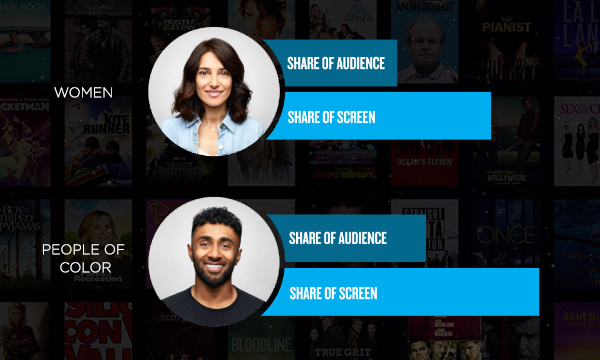
Nielsen introduced Gracenote Inclusion Analytics today. This service gives visibility into the gender, race, ethnicity and sexual orientation of talent appearing on TV and the audiences watching.
Nielsen sees this data empowering “content creators, owners, distributors and advertisers with much-needed data around on-screen diversity and representation to enable more inclusive content.”
For example, a distributor can highlight content from its catalog of diverse female leads for Women’s History Month. Or a studio can evaluate whether they are meeting Diversity, Equity and Inclusion benchmarks. Also, brands can use the service to identify the most inclusive programming to help advertising decisions.
Nielsen says their data shows “significant imbalances between representation in content and key audience groups which, by addressing, would serve to accelerate equity in entertainment.”

Metrics include:
- Share of Screen quantifying an identity group’s (e.g., women, LGBTQ, Black) representation among the top recurring talent
- Inclusion Opportunity Index comparing share of screen for an identity group (e.g., women) to their representation in population estimates
- Inclusion Audience Index comparing share of screen for a group to their representation in the program’s viewing audience
Gracenote Inclusion Analytics utilizes Gracenote Global Video program metadata and Studio System celebrity race and ethnicity data with Nielsen Television Ratings and Nielsen SVOD Content Ratings data.


